Friday, December 15, 2006

Was Our November A Canary In A Coal Mine? How Hot Might It Get In The Next Few Decades? You Tell Me...


Click on chart to enlarge - courtesy of Yahoo!/The Weather Channel

Warning!!

This IS a RANT!

...and not a very nice or funny one.

I knew we had an abnormally warm November here, I lived it, but the hair on the back of my neck stood up when I saw these Yahoo!/Weather Channel temperature charts!

If these numbers are accurate, and I'm assuming they are, we've just had one extremely freakish November.


In Big Bear City we surpassed our previous record high November temperature by 15° F.


FIFTEEN DEGREES!!!


And, not only that! We surpassed the previous November record of 74° on 22 of those 30 days, with seven days of 80°+ temps. And not one day of the month did we dip down to even the average low temp of 25°.

It was 89° on November 7th (88° on the 8th), fifty-five degrees above average, and just 5° shy of our all-time summer high of 94°.


All over town I hear people cheerfully saying, "Isn't this weather wonderful?", as they go to and from their X-Mas shopping destinations in their SUVs.

Yes folks, it's just lovely, and pretty soon you may not even have to battle the traffic that comes with living in a ski resort either.

Of course you won't have anywhere to work because Big Bear's economy is dependent upon the ski industry. So you'll have to sell your house and move someplace where there is work, but then your house won't sell because there'll be a glut of sellers and no buyers.


And, we may not need to worry about forest fires much longer either, because, with temps like these, the bark-beetles can just chew their way through the forest all year long. Who needs a forest anyway? Then we can just haul all that dead wood home to burn in the fireplace instead of letting the wildfires have it. But we may not need fireplaces to keep warm, we may need air-conditioning instead.


Ahhhhh.... Endless Summer!


So hop in those Escalades, Excursions, Navigators and Hummers folks! You know, the ones with the Jesus fish, the American flags, and the 'family values' oriented bumper stickers plastered all over ém.


Make all the trips you want to McDonalds, Starbucks, Carl's Jr., Taco Bell and Burger King . They all have drive-throughs and you don't even have to climb down out of the car to notice the weather.

Just sit there in your air-conditioning listening to Fox News, Rush Limbaugh or NASCAR results while you wolf down those mega-calories.

Even the Pharmacy has a drive through so you can refill your Prozac, Valium and Viagra prescriptions right from the driver's seat. And if you forget to have your hair cut, or your nails done, you can always make another trip. No worries! Because, thanks to oil subsidies, corporate welfare, and very creative economic policies, gasoline is back below $3 a gallon.

But the hidden costs are becoming more obvious aren't they?

Global Warming may be the most insidious, but what about that $350 billion of our hard earned money spent on the War in Iraq? Or the tens of thousands of human lives sacrificed, just so we can continue driving behemoth gas hogs around in circles all day.

Ooops! Sorry!
Do I sound a bit testy?

Perhaps I'm sick of hearing people say Global Warming is no big deal?
Or maybe I'm a little under the weather from breathing all those exhaust fumes on my walk to the grocery store yesterday morning, especially the diesel fumes?

Oh Look! I just noticed the first syllable of diesel is 'die', as in Die-Off!

I wonder what it feels like to be broiled?
Or what it's like to watch your children or grandchildren being cooked in a solar oven.

Stick around, the fun's just beginning...
...but the party's coming to an end.
Whether we believe it or not.

Pissed-Off?
Me?

Hey, it's my blog, and I can vent today if I want to!

Because our collective ignorance is infuriatingly pathetic and Peak Oil can't come soon enough for me...

...so you can consider this my exhaust, I certainly have to breathe enough of everyone else's!

Love, Peace, & Mercy Earthlings...

It’s looking to me like we're gonna need plenty of each!

The chart below shows the daily high and low temperatures for Big Bear this past November.

Enlarge it and compare them to the record highs, lows, and average from the chart above.


Click on chart to enlarge - courtesy of Yahoo!/The Weather Channel
Most of the folks who visit this blog are well-informed about Global Warming and are making big personal changes toward sustainable living. This post isn't meant for you.
It's for the masses who are either ill-informed or just don't seem to give a damn!
The people who say, "Isn't this weather wonderful?, Have a nice day, and a Merry Christmas"
They sound to me like Stepford Children.
All programmed to speak polite, meaningless, rose-colored gibberish.
Maybe I should apologize for another of my impassioned outbursts, but I'm not going to.
This is a real world we're living in, and I have a full spectrum of feelings about it, so there's little relevence in my simply posting pretty pictures every day.
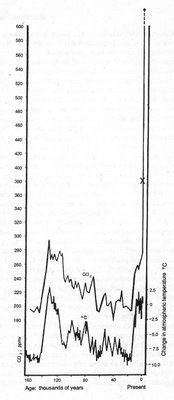
Now I'd like to refer you back to some charts I posted last January which show the correlation between atmospheric CO2 levels and temperature. Click here to review the charts, especially the fourth one down which uses data from the past 160,000 years. Compare where the CO2 levels are right now with the historically corresponding temperature line.
Then you tell me. How hot do you think it might get?

Labels: , , , , , , , , , ,

Tuesday, January 17, 2006

Does It Seem A Bit Warm?

Several people at the blogs we are linked to have commented on the unusually warm winter they are experiencing in their parts of the world, and there's been some discussion on whether or not the steeper slope of global warming is now upon us.

For about 15 years I've been saving articles and charts related to global warming and climate change so I thought I'd share some of these with you, so you can digest the information and arrive at your own conclusions, or speculations.

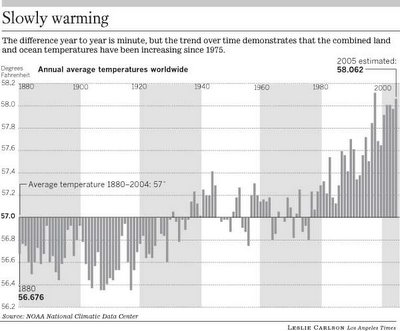
The graph below is from a newspaper article this past December and shows annual average temperatures since 1880.

Temperatures started their steepest climb in 1975, but if you study the graph you'll see they started gradually climbing back around 1910, just about the time the automobile was becoming popular and everyone was getting their own personal infernal combustion engine.

It's interesting that the heading reads "Slowly warming", because when I look at the rest of the charts, it appears to me that, historically speaking, this is actually a quite rapid and alarming change.


Click on graph to enlarge

The following graph shows the correlation between atmospheric CO2 and temperature change over the past 2,000 years. I think this graph includes data through 2003.


Click on graph to enlarge

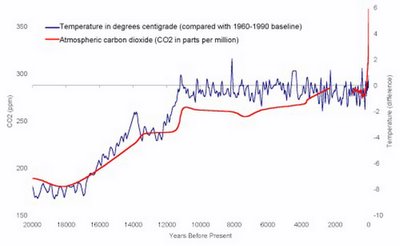
The next graph very clearly shows the relationship between CO2 and temperature during the past 20,000 year period. As you can see, the longer the timeline for the CO2/Temperature comparison, the more extreme the recent increases seem to be.


Click on graph to enlarge

Below, another CO2/Temperature correlation spread out over 160,000 years, really looks scary to me. It includes the projected increase in the very near future to over 600 ppm of CO2 in the atmosphere. The is an X on the upward line marking 380 ppm which is the current level of of CO2. If you notice how closely the temperature aligns itself with CO2 levels it looks to me like we're in for some really big changes very, very soon.


To the left a graph shows the increase in our human population since about 950 A.D. and not surprisingly the steepest increase starts at just about the same time as that CO2 begins its climb.

And last, but not least, the chart below shows the radical increase in species extinctions since about 1910.

I'm no scientist but good old-fashioned common sense tells me there's something very disturbing in this information. I don't think it takes a genius to conclude that what is happening is the result of human activity, and that we are in real deep trouble if we don't change our ways soon.


Click on graph to enlarge

I've posted this incomplete as I'll be adding some links to it if any of you would like do some more research.

Labels: , , ,

Tuesday, January 10, 2006

A Toast To Norene's Five Percent!

A new blog in the sidebar, Norene's Five Percent, has re-focused my attention on the efforts we've been making here at Earth Home Garden for the past 10 years or so toward reducing our waste and consumption.

During that period of time we swore off owning an automobile (January 31st, 1997) which we were driving about 12,000 miles per year. A modern vehicle that gets 20mpg spews about a pound of carbon dioxide per mile, so, by my reckoning, we've personally eliminated close to 100,000 pounds from the atmosphere in the past 9 years (This isn't something everyone can do, but in our situation it was feasible to try it, and we're very happy with our decision). You'll notice that driving 12,000 miles per year for 9 years should add up to 108,000 pounds of CO2, but I think we have driven maybe a total 6,000 to 8,000 miles since 1997 in rented or borrowed cars.
I know we drove about 3,000 miles, this past few months alone, going to the hospital to visit our son and taking him to doctor appointments. We rented a car for that purpose until our neighbor Cheri said we could use hers whenever we needed. But that's mostly behind us at this point.

About 1993 we made a list of all the electric appliances we could do without, the micro-wave, the food processor, the blender, the coffee maker etc., and then when our refrigerator, washer & dryer died we replaced them with the most energy efficient ones we could afford, and about that time we changed every light bulb in the house to a compact flourescent (an article I read recently cited a study which concluded that if everyone in California switched all their bulbs to flourescent our population could double before we'd need to build another power plant---I sure don't want to see the population double---but that was a revelation).

In 2002 we heavily insulated the roof (about R39 total) and the floor of our cabin, installed dual-pane low-e glass windows & doors, and a couple of years earlier we had replaced our water guzzling lawn with drought-tolerant plants & flowers native to this area.

In any given year none of these projects required 5% of our energy (well maybe the roof did, a friend & I spent two solid weeks up there, and the cost was about $3,500 total) but the resulting savings in resource consumption and utility costs are compounding quite rapidly. The State of California also gave us about a 25% rebate on the cost of the doors, windows and insulation.

But there is always more to be done and I see that we've slacked off a bit in our focus & commitment (it was a tough year for us), so here's to Norene for the wake-up call. I wonder how much could be accomplished if I were just 5% more thoughtful each day.

Here are some comparisons of our historical use of gas, water and electricity with our current usage.

Natural Gas

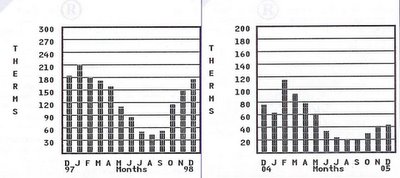
Below you will see two graphs scanned from previous gas bills, at the left is the December 1998 bill, and, on the right, December 2005. Don't go by the height of the columns, because the scale is adjusted to ones usage, look at the actual numbers on the left for therms used. This December we used just over 40 therms of gas as compared to about 75 last December, a 47% reduction, and we used over 180 therms for the same month of 1997, which means a reduction of 78% from 8 years ago (Not bad considering our elevation of 6,750 ft. in heavy snow country, and we're still improving).


Click on photo to enlarge

Electricity

Our most recent electric bill shows that we used 528 KWH for the 2 month period of October & November, or 8 KWH per day, a 31% increase over the previous year, which means we've been backsliding on our conservation efforts this year (too much blogging maybe), but I dug out an old electricity bill to compare with our current bill and found that for the same 2 month period in 1996 we used 929 KWH or 14.3 KWH per day, so even if we slipped a bit we're still conserving 44% more electricity than in 1996. And we're 71% below the national average of 28 KWH per day, but we can do better.


Click on photo to enlarge

Water

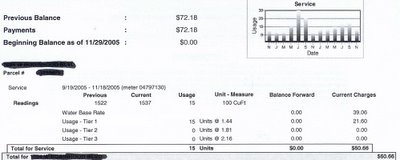
We don't have an older water bill to compare our current usage with but I called the Community Services District and asked if they kept historical records of usage and they told me that our record usage was 59 units for 2 summer months back in the days when we had lawn here instead of the native plant garden. Because we grow vegetables our usage still increases in summer, but our rain barrel storage and careful monitoring have this past summer resulted in a peak usage of about 20 units, a 66% reduction from our highest consumption rate several years ago.


Click on photo to enlarge

Labels: , , , ,

Saturday, March 05, 2005

Native Plant List


Posted by Hello Penstemon eatonii - Summer 2004

Native Big Bear area species established in our garden as of June 15, 2004…
(the list is incomplete and will be updated soon)


Wildflowers

Achillea millefolium----------------------------Common Yarrow
Allium sp.--------------------------------------Wild Onion
Apocynum cannabinum-------------------------Indian Hemp
Arabis pulchra----------------------------------Rock-Cress
Argemone munita------------------------------Prickly Poppy
Aquilegia formosa------------------------------Crimson Columbine
Calystegia occidentalis--------------------------Wild Morning-Glory
Castilleja applegatei-----------------------------Indian Paintbrush
Cirsium occidentale var. californicum----------Thistle
Claytonia perfoliata-----------------------------Miner’s Lettuce
Dichelostemma capitata--------------------Wild Hyacinth/Blue Dicks
Epilobium canum-------------------------------California Fuschia
Erigeron foliosus--------------------------------Fleabane
Eriodictyon trichocalyx--------------------------Yerba Santa
Eriogonum fasciculatum-------------------------California Buckwheat
Eriogonum molestum---------------------------Pine Buckwheat
Eriogonum umbellatum-------------------------Sulfur Flower
Eriogonum wrightii-----------------------------Wright’s Buckwheat
Erysimum capitatum----------------------------Western Wallflower
Eschscholzia californica-------------------------California Poppy
Geranium richardsonii--------------------------Wild Geranium
Gilia splendens----------------------------------Gilia
Horkelia rydbergii ------------------------------Rydberg’s Horkelia
Iris missouriensis--------------------------------Wild Blue Iris
Lessingia filaginifolia----------------------------Mountain Aster
Lilium humboldtii-------------------------------Humboldt Lily
Linum lewisii------------------------------------Blue Flax
Lupinus breweri---------------------------------Brewer’s Lupine
Lupinus excubitus-------------------------------Grape Soda Lupine
Lupinus lepidus var. confertus-------------------Dwarf Lupine
Lupinus polyphyllus-----------------------------Giant Lupine
Matricaria matricarioides------------------------Pineapple Weed
Monardella australis-----------------------------Coyote Mint
Nicotiania attenuata-----------------------------Coyote Tobacco
Oenothera californica---------------------California Evening Primrose
Penstemon eatonii-------------------------------Firecracker Penstemon
Penstemon grinnellii-----------------------------Bumble-Bee Penstemon
Penstemon labrosus------------------------------Scarlet Penstemon
Phacelia campanularia---------------------------Desert Blue Bells
Phacelia imbricata-------------------------------Mountain Phacelia
Potentilla glandulosa----------------------------Sticky Cinquefoil
Ranunculus californicus--------------------------Buttercup
Stachys albens-----------------------------------White Hedge Nettle
Tanacetum parthenium--------------------------Feverfew
Urtica dioica-------------------------------------Stinging Nettle


Cacti

Echinocereus triglochidiatus---------------------Hedgehog Cactus
Opuntia basilaris---------------------------------Beaver-Tail Cactus
Opuntia phaeacantha----------------------------Prickly-Pear Cactus


Shrubs

Amelanchier utahensis---------------------------Utah Service-Berry
Arctostaphylos patula----------------------------Greenleaf Manzanita
Artemesia ludoviciana----------------------------Silver Wormwood
Artemesia tridentata-----------------------------Great Basin Sage
Purshia tridentata var. glandulosa----------------Antelope Bush
Salvia pachyphylla----------------------------------Rose Sage
Symphoricarpos rotundifolius var.parishii--------Snowberry


Trees

Abies concolor-----------------------------------White Fir
Calocedrus decurrens----------------------------Incense Cedar
Cercocarpus ledifolius var. intermontanus-----Mountain Mahogany
Juniperus occidentalis----------------------------Western Juniper
Pinus jeffreyi-------------------------------------Jeffrey Pine
Populus tremuloides-----------------------------Quaking Aspen
Quercus kelloggii--------------------------------California Black Oak


Non-Native drought tolerant species established in garden as of June 25, 2004…


Wildflowers

Achillea tomentosa--------------------------------Wooly Yarrow
Delphinium nudicaule-----------------------------Red Larkspur
Nolina parryi-------------------------------------Parry’s Nolina
Penstemon palmeri-------------------------------Palmer’s Penstemon
Yucca baccata------------------------------------Banana Yucca


Shrubs

Berberis (Mahonia) aquifolium var. repens--------Oregon Grape


Trees

Sequoiadendron gigantium-----------------------Giant Sequoia
Picea pungens------------------------------------Colorado Spruce
Picea pungens var. glauca-------------------------Colorado Blue Spruce
Picea pungens var. pendula-------------------Weeping Colorado Spruce

Labels: , ,

voicexml
voicexml
Creative Commons License
This work is licensed under a Creative Commons Attribution-Noncommercial-No Derivative Works 3.0 Unported License.